
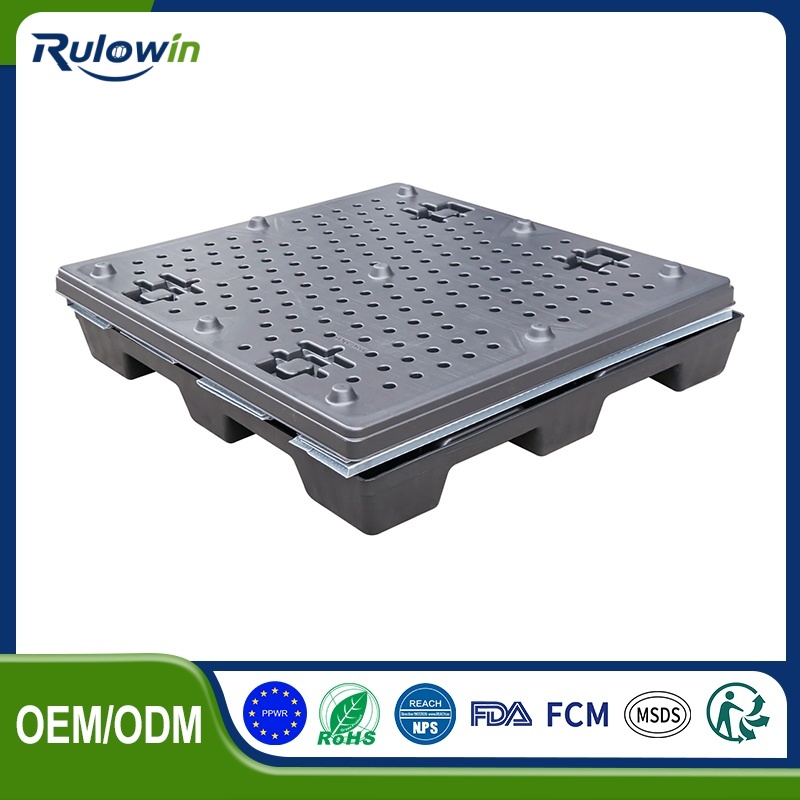
When a container fleet is reconciled, the missing containers are almost always more numerous than expected. They did not vanish – they left at one of a small number of predictable points, and each of those points is countable. Establishing which point is responsible is straightforward and it usually narrows the problem to one or two places.
At the customer
The most common single destination. Containers are delivered, emptied, and then sit. They are used for something else, they are mixed with the customer’s own containers, or they are simply never collected. Where a lane delivers to many small customers rather than a few large ones, this is usually the dominant loss route and it is largely a collection problem.
In transit and at the carrier
On a pallet, in a trailer, at a transhipment point, or in a carrier’s depot. Where containers are moved by a third party, the third party’s handling of empties is outside the shipper’s control and usually receives little attention. Where loss concentrates on lanes with a transhipment, the transfer point is the place to look.
At the supplier or the subcontractor
Containers sent out to a subcontractor for a process step come back slowly or not at all, particularly where the subcontractor has their own containers of a similar appearance. Where a fleet serves an outsourced process step, that step needs its own return arrangement rather than being assumed to behave like an internal one.
In the building
In a mezzanine, behind a rack, in a container that is itself lost, or in an area that is not part of the normal count. A fleet that looks short is often complete and simply distributed over more places than the count covers. Where a count is done thoroughly for the first time, some of the “missing” containers turn up.
In scrap and in the waste stream
A damaged container put in a skip is a container lost, and it is usually not recorded as a retirement. Where a site has no defined route for damaged containers, they go into general waste, and the loss is invisible in the data. A designated place for damaged containers is the cheapest loss-reduction measure available.
Measuring it by lane
Count containers dispatched and returned per lane per week. The difference, expressed as a percentage, is the loss rate for that lane, and the rates differ enormously between lanes. Where a fleet is losing containers, the per-lane figures show where, and the answer is usually concentrated in one or two places rather than spread evenly.
What reduces it
A defined collection arrangement with the customer, written into the commercial terms. A container that is visibly identifiable as belonging to someone else. A return deadline with a consequence. And a periodic reconciliation that makes the loss visible rather than absorbed. All four are process measures and none of them involve the container. The fleet-level view is in managing containers as assets.
Why the count and the contract go together
Loss falls sharply where the containers are counted and where somebody is accountable for the number. Those are the same intervention seen from two sides: the count makes the loss visible, and the accountability makes it somebody’s problem. Either alone achieves part of the result. Together they typically take a loss rate from the high teens to the low single figures within a year.
The number to aim for
A well-run closed loop loses a few per cent a year. A poorly run one loses twenty or more. Where a fleet does not know its loss rate, it is almost certainly in the second category, and finding out the number is the first step to reducing it.