
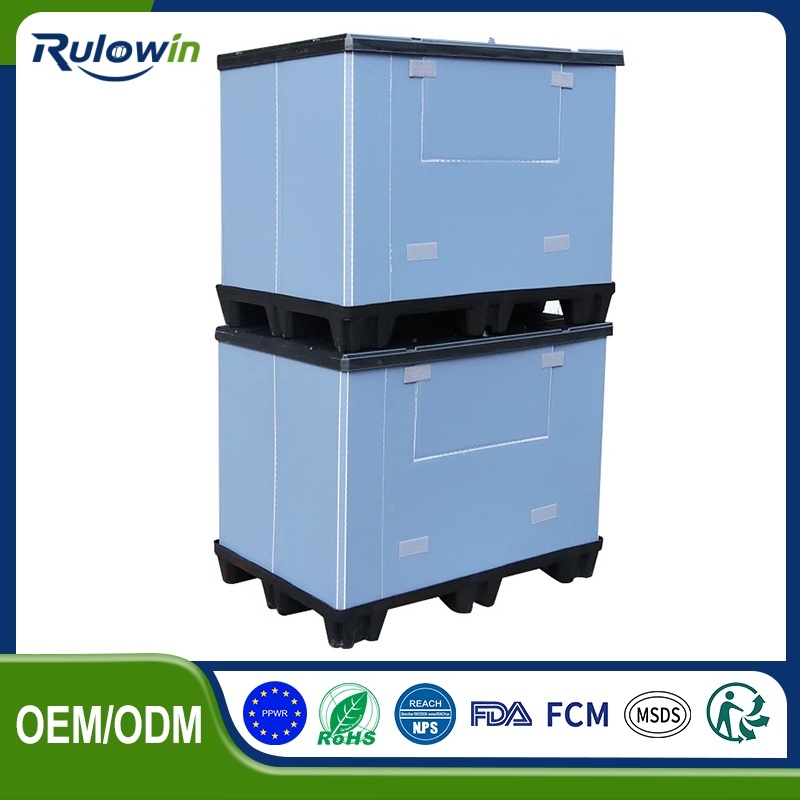
A container fleet count is usually avoided because it sounds like a week of work, and it is avoided until someone needs the number for a budget. The reason it sounds slow is that it is imagined as a single simultaneous count of everything. Done by location, on a rolling basis, the same result arrives in a fraction of the time and with better data.
Why one big count is the wrong shape
Containers move. A simultaneous count has to freeze movement, which means stopping the operation or accepting a number that is wrong the moment it is taken. It also produces a single figure with no structure, so when the number is lower than expected there is nothing to indicate where the difference is.
Counting by location instead
Every location holds a countable quantity, and the locations are stable: each plant, each customer, each warehouse, each carrier depot, and each state – in service, in transit, in wash, in repair, in storage. Counting location by location over a period, with each location counted at a different time, needs no freeze and produces a structured result.
The seven buckets
On site, at customers, at suppliers, in transit, in the wash, in repair, and in storage. Every container is in exactly one of them. A count that covers all seven reconciles; one that covers the first three does not, and the missing amount gets attributed to loss when it is often just elsewhere. The categories behind loss are described in where containers actually go missing.
How often
Annually as a full reconciliation, quarterly for the largest locations, and continuously for anything that is already tracked. Where a fleet has a barcode or RFID programme, much of the count arrives for free and the manual exercise shrinks to the locations that are not instrumented.
Making it fast
Count stacks rather than individual containers where containers nest or stack predictably – a stack of ten nested containers is one measurement, not ten. Use a marked gauge for stack height. And count at the same time of day, because the distribution between locations shifts through a shift.
What to do with the difference
A count lower than the records means loss, and the per-lane figures say where. A count higher than the records means containers were bought and never recorded, which happens more often than it should. Either way, the reconciliation is the point – the number itself is less useful than the difference and where it came from.
Recording it
Date, location, quantity by type, and any difference against the record. Four columns, and after two counts the trend is visible. Where a fleet has never been counted twice, the first count produces a number and the second produces information – which is why the first count should be done as soon as possible rather than when it is needed.
What to do when a location will not be counted
Some locations cannot be counted directly – a customer’s site, a carrier’s depot, a container in transit. Those are estimated from the flow instead: what was dispatched minus what was returned, adjusted for anything known. An estimate is better than a gap, and marking the figure as an estimate keeps the reconciliation honest. Where the estimate consistently disagrees with the eventual count, the flow records are wrong, and that is worth finding out.
Where a customer holds a large share of the fleet, ask for a figure twice a year rather than annually. Most will provide one if the request is simple, infrequent and tied to something they care about – usually a charge for containers not returned.
What it enables
A replacement forecast from a real base, a loss rate per lane, and a basis for the asset value of the fleet. Three outputs from one day’s work, and all three are needed at some point – usually at short notice.